PhysRSI-Eval

PhysRSI-Eval · arXiv 2610.26848

Where is Physical RSI capability from?An Observational Scaling Law of LLM-as-policy

Zekai Li*, Jiayi Yu*, Jinlu Zhang*, Luyang Niu*, Zekun Qi*, Jun Zheng, Xuchuan Chen, Dairu Liu, Yintianrun Zhang, He Wang†, Li Yi†

Galbot Team  ·  * Equal contribution  ·  † Corresponding authors

PhysRSI-eval quantifies physical recursive self-improvement (RSI) through a five-axis metric — First-Attempt Performance, Efficiency, Success, Budget and Improvement — across 18 manipulation tasks under a fixed interaction budget, and asks three questions.
Overview

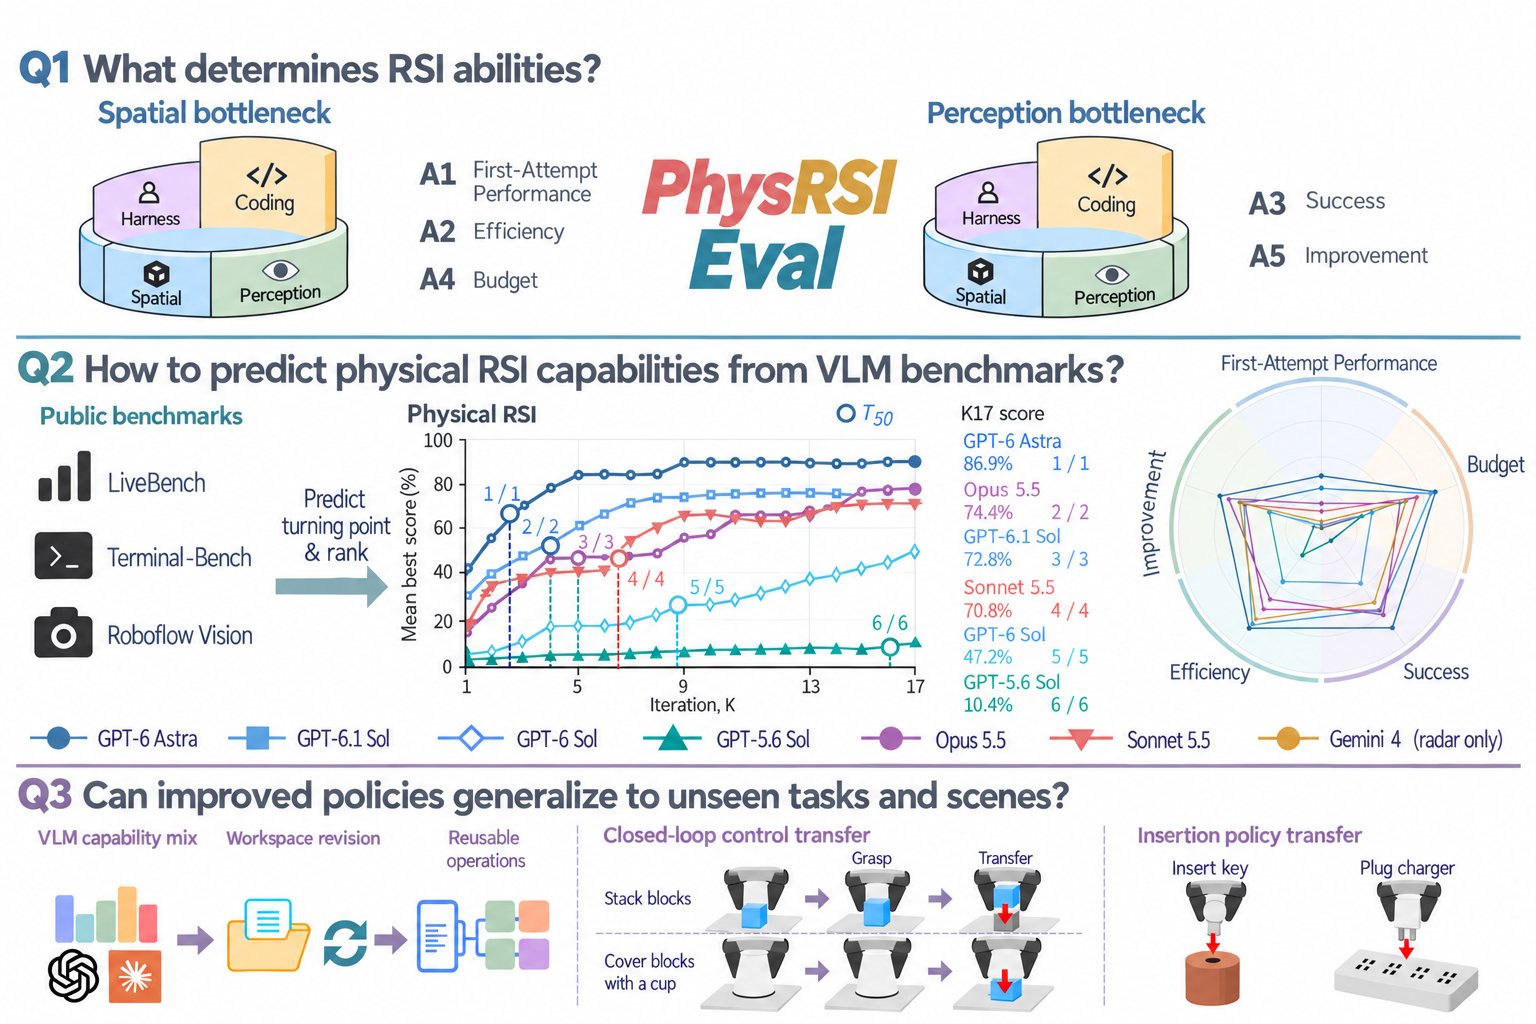
Overview with three rows. Q1: two barrels with staves for harness, coding, spatial and perception; a spatial bottleneck for First-Attempt Performance, Efficiency and Budget, and a perception bottleneck for Success and Improvement. Q2: public benchmarks predict the turning point and rank of each system's best-score curve, next to a five-axis radar. Q3: reusable operations transfer from stacking blocks to covering blocks with a cup, and from key insertion to plugging a charger.
PhysRSI-eval overview. (Q1) Capability sources and the Physical Barrel Hypothesis. (Q2) Five-axis quantification and observational scaling of performance, gain timing and model rankings. A1–A5 measure the first-attempt score, how early gains appear, the best score attained, the physical budget saved before first success, and the fraction of first-round failures later solved. T50 is the half-gain round, the first round at which the best mean score reaches half of its K1–K17 gain. (Q3) Overfitting and generalization across tasks and scenes.

Benchmark

A controlled loop of physical attempts

18
RoboDojo manipulation tasks
K0 + 17
first attempt + self-improvement rounds
5
axes of physical RSI
6 + 1
systems (+ Gemini 4 on ten tasks)
  • A1First-Attempt Performance
  • A2Efficiency
  • A3Success
  • A4Budget
  • A5Improvement
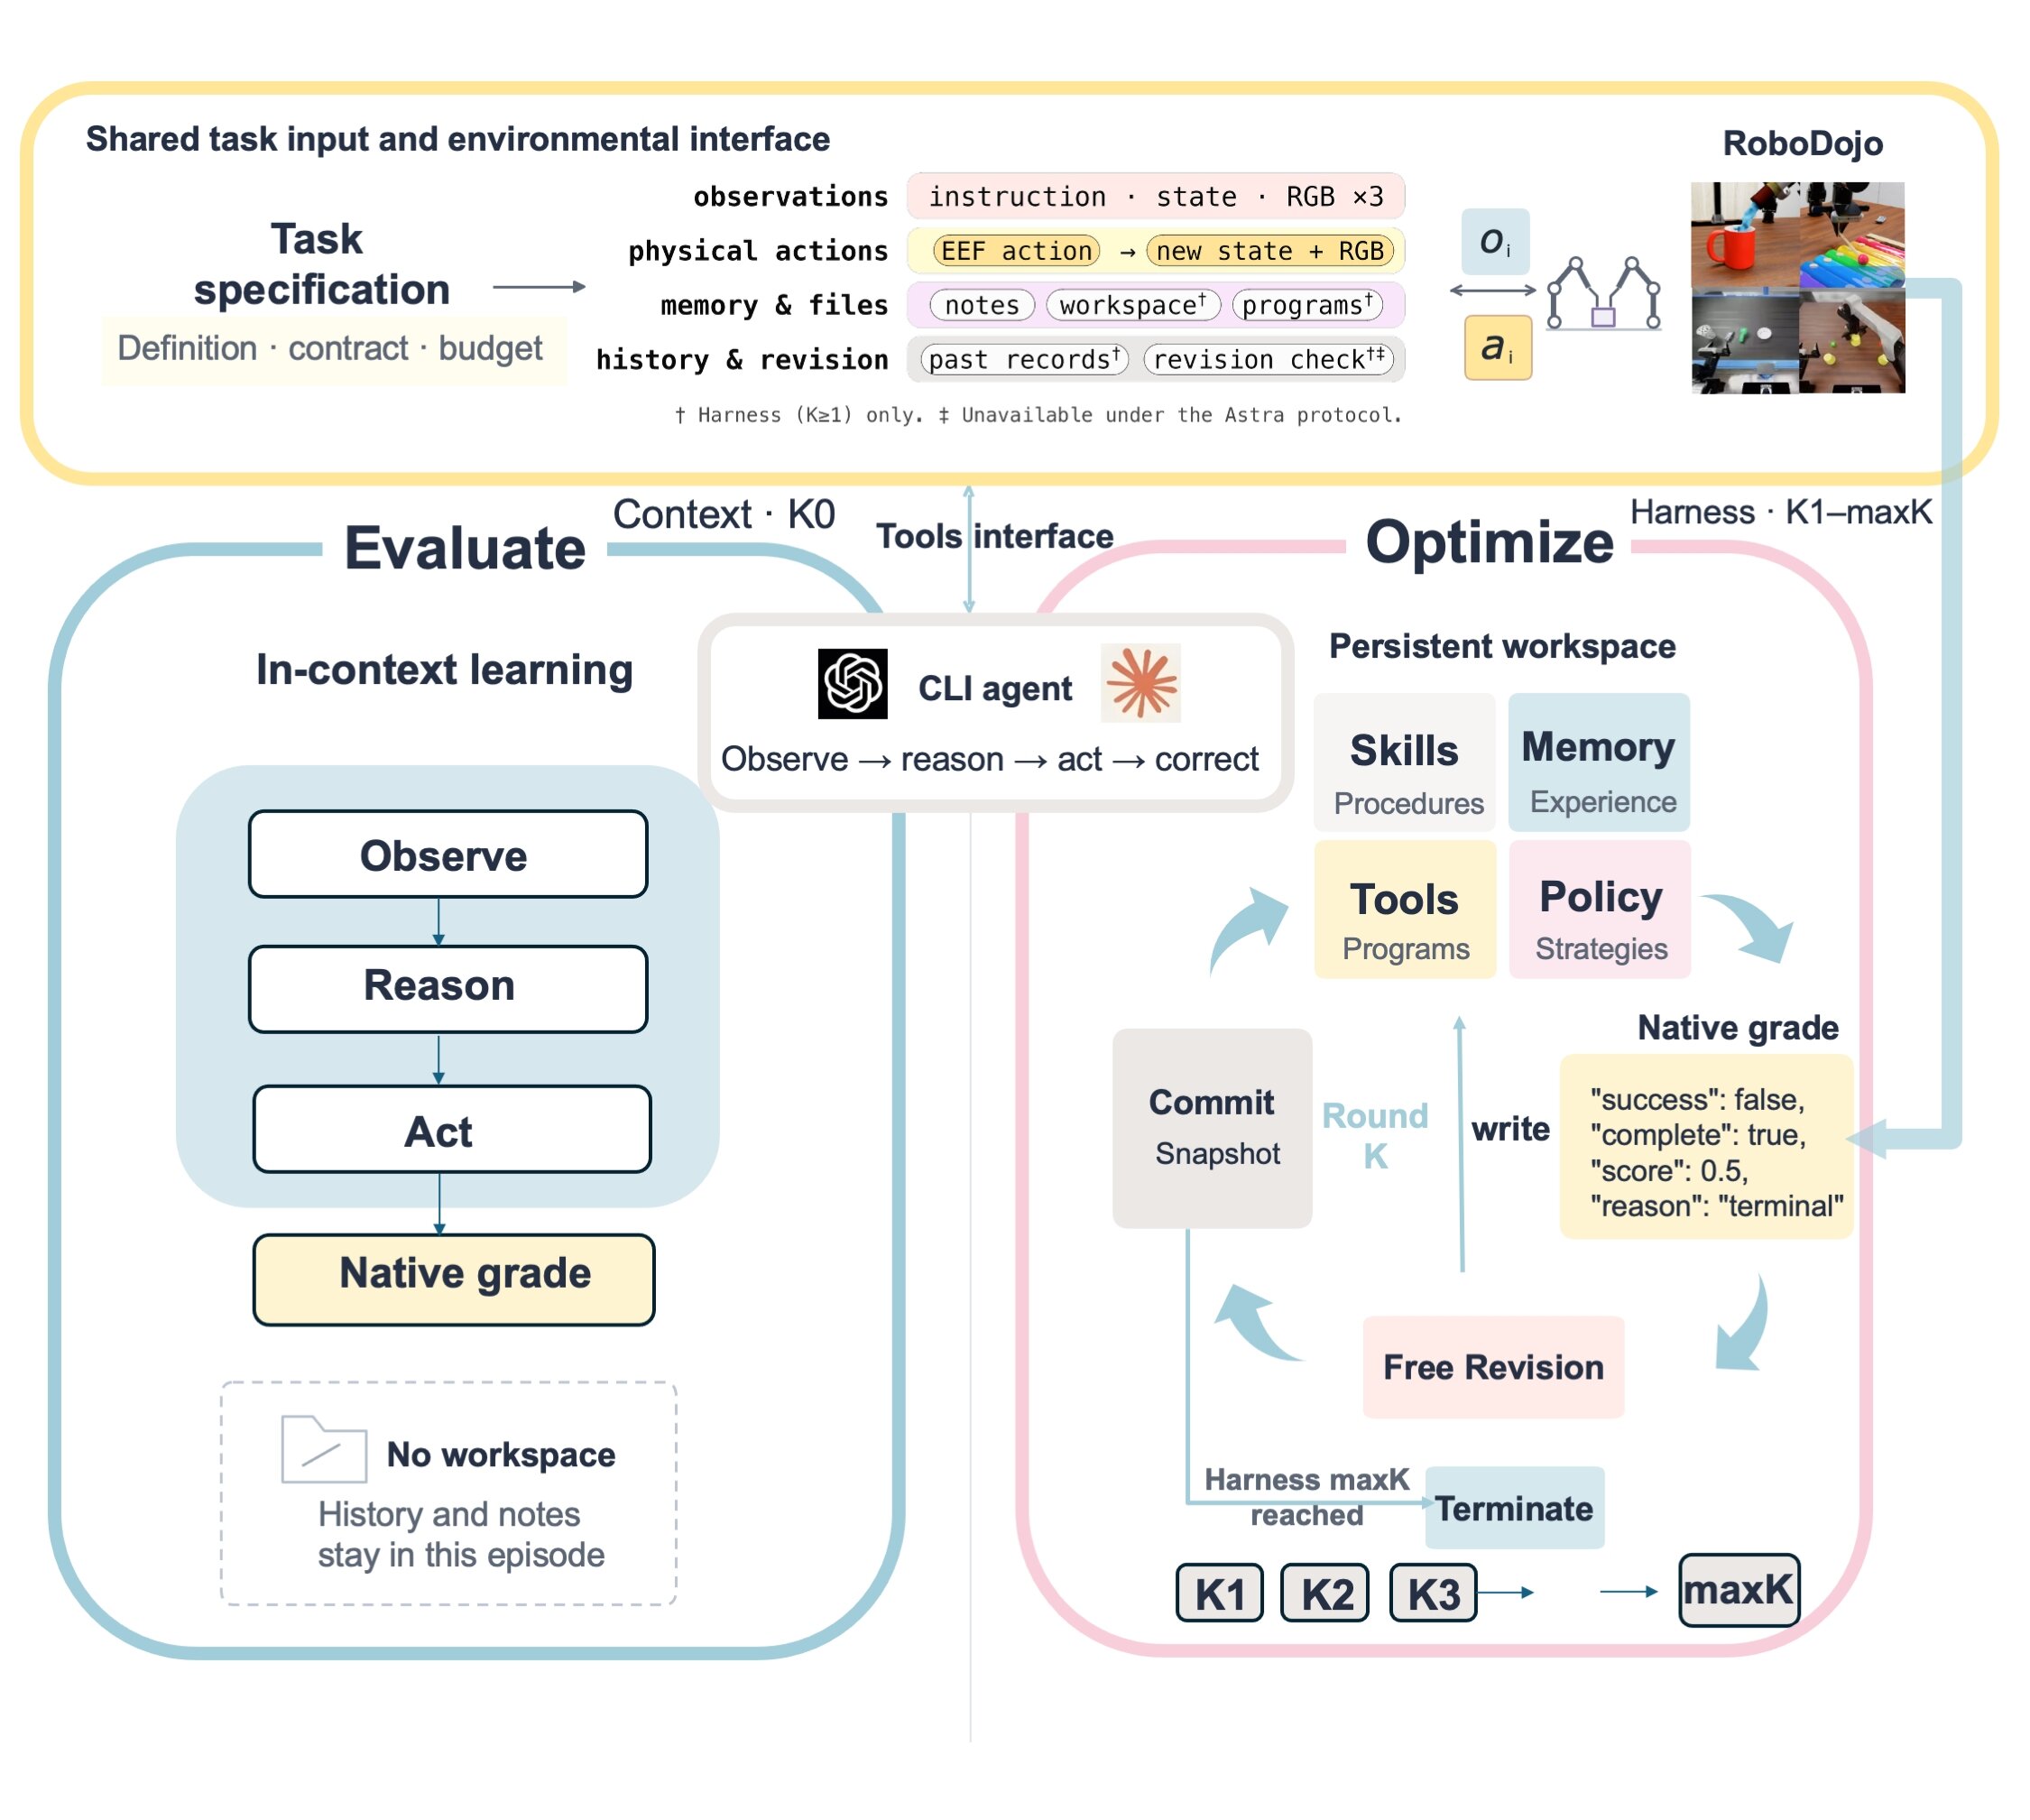
Shared task input and robot interface on top; left, the Evaluate stage K0 with one in-context observe, reason, act episode and no workspace; right, the Optimize stage K1 to KH with a persistent workspace of skills, tools, policy and memory, native grading, revision with robot actions closed, and commit.
Two stages, one interface. Left, Evaluate (K0): one in-context episode, no workspace. Right, Optimize (K1–KH): each round runs from a persistent workspace of skills, tools, policy and memory, is graded natively, revised with robot actions closed, and committed, until the first native success or the round limit.

Benchmark

Tasks across difficulty levels
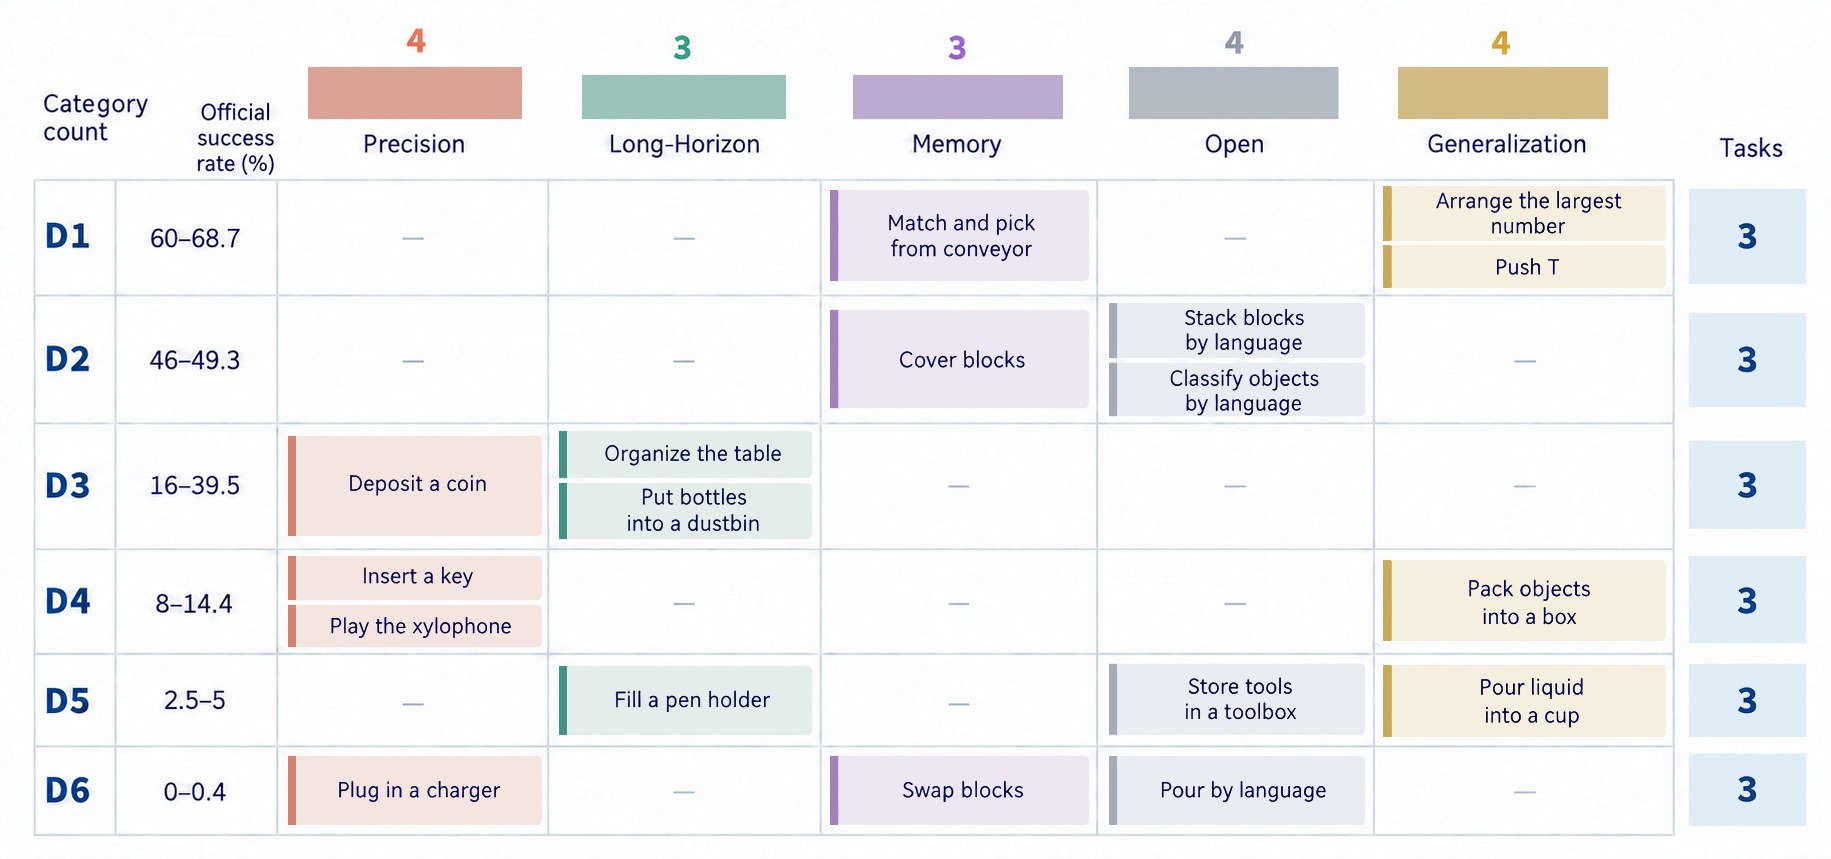
The 18 RoboDojo tasks arranged by difficulty stratum D1 to D6, three tasks each, covering RoboDojo's five official task categories.
Difficulty-balanced task sampling. Three tasks per difficulty stratum, from D1 (highest official RoboDojo success rate) to D6 (lowest), covering RoboDojo's five official task categories. Systems: GPT-6 Astra, GPT-6.1 Sol, GPT-6 Sol, GPT-5.6 Sol, Claude Opus 5.5, Claude Sonnet 5.5; Gemini 4 in a separate ten-task run.

Q1: Where is Physical RSI capability from?

Spatial
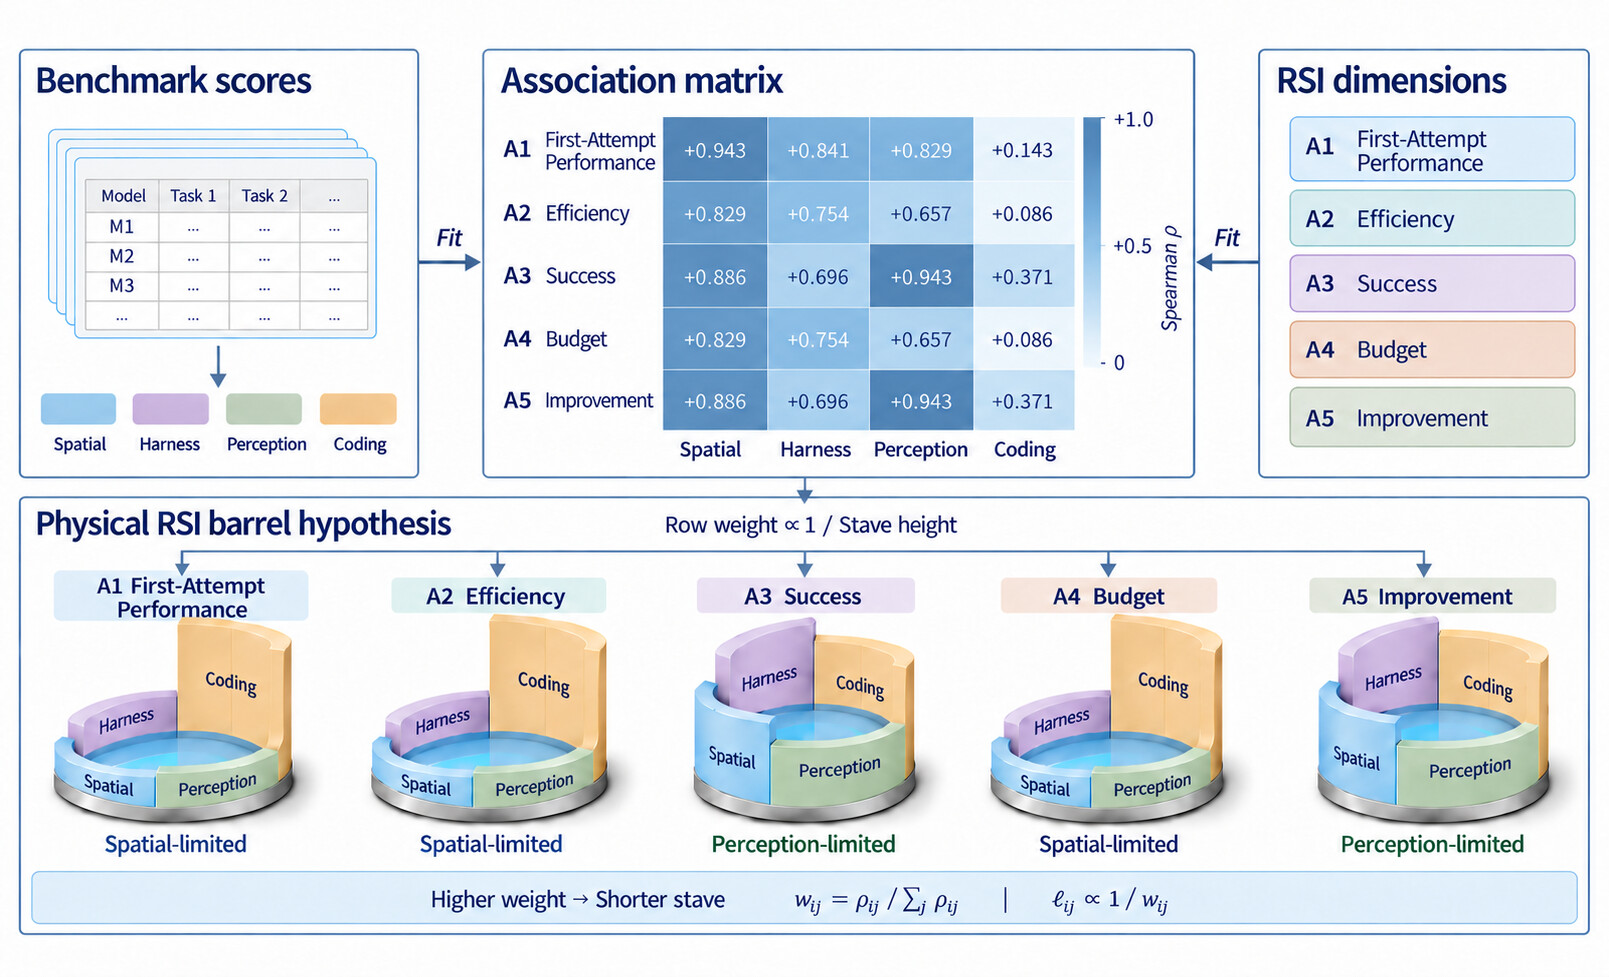
ρ = 0.94

with A1; 0.83 with A2 and A4

Perception
ρ = 0.94

with A3 and A5

Coding
ρ ≤ 0.37

weakest association with every axis

Physical Barrel Hypothesis

Different aspects of improvement may have different capability bottlenecks: spatial reasoning for starting well, perception for recovering from failure. Strong coding cannot always compensate for a weakness elsewhere.

Left: rank-association matrix between four capability groups (spatial, harness, perception, coding) and the five RSI axes across six systems. Right: one barrel per RSI axis with a stave per capability group.
Capability associations and the barrel hypothesis. Exploratory rank associations across six systems on the 18 tasks. Each barrel represents one RSI axis, with a stave per capability group; stave heights illustrate a proposed bottleneck interpretation.

Q1: Where is Physical RSI capability from?

Five-axis profiles

Five-axis profiles · seven panels, then the overlay
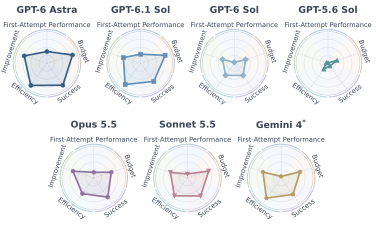
Five-axis profiles. Right: one panel per system, drawn in turn. Left: the same seven profiles overlaid. Axes clockwise from the top are First-Attempt Performance (A1), Budget (A4), Success (A3), Efficiency (A2) and Improvement (A5), on a shared 0–1 scale. Hover a profile or a legend entry to isolate it. *Gemini 4 uses its ten evaluated tasks.

Q1: Where is Physical RSI capability from?

Five-axis profiles, as drawn in the paper
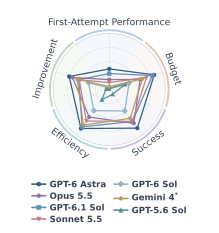
Seven five-axis profiles overlaid on one radar chart. One five-axis radar panel per system: GPT-6 Astra, GPT-6.1 Sol, GPT-6 Sol, GPT-5.6 Sol, Opus 5.5, Sonnet 5.5 and Gemini 4.
Five-axis profiles, as drawn in the paper. Left: seven overlaid profiles. Right: one panel per system. Axes clockwise from the top are First-Attempt Performance (A1), Budget (A4), Success (A3), Efficiency (A2) and Improvement (A5).

Q2: How can we quantify Physical RSI and its scaling law?

Higher attained scores can come with later gains and greater physical costs: Opus 5.5 beats GPT-6.1 Sol on Success (0.744 vs 0.703) but trails on Efficiency (0.609 vs 0.822) and Budget (0.579 vs 0.808).

SystemTasksA1 First-AttemptA2 EfficiencyA3 SuccessA4 BudgetA5 Improvement
GPT-6 Astra180.36760.85940.85090.84290.7500
GPT-6.1 Sol180.28430.82240.70280.80810.5714
GPT-6 Sol180.03060.46580.47220.37180.3889
GPT-5.6 Sol180.01200.22470.10370.30130.0556
Claude Opus 5.5180.17690.60910.74440.57940.6875
Claude Sonnet 5.5180.12410.69460.70060.69840.5625
Gemini 4*100.05000.78310.63500.62410.6000

Five-axis profiles. K0 scores are averaged over three runs per task. *Gemini 4 is evaluated on ten tasks with one K0 run per task.

Q2: How can we quantify Physical RSI and its scaling law?

Public capability and physical RSI separate differently

Across the four GPT systems, mean public benchmark scores span 24 points; the physical profile mean spans 59.5 points. GPT-5.6 Sol stays near zero cumulative success for 16 rounds.
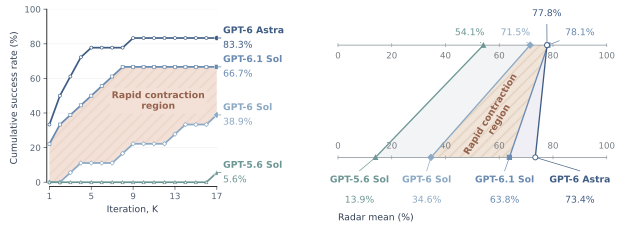
Left: cumulative success over refinement rounds for the GPT systems, with a shaded gap between GPT-6.1 Sol and GPT-6 Sol. Right: mean public benchmark score versus the mean of the five physical RSI axes.
Public capability and physical RSI separate differently. Left: cumulative success during refinement on 18 tasks; the shaded region marks the gap between GPT-6.1 Sol and GPT-6 Sol. Right: mean public score over 17 selected benchmarks versus 100×(A1+A2+A3+A4+A5)/5.

Q2: How can we quantify Physical RSI and its scaling law?

How far, and how early?

Best mean score by round · K1 → K17
The climb, round by round. Solid lines: best mean score reached by round k; faint dashed lines: the mean score of that round. Circles mark T50, the half-gain round. Six systems on 18 tasks; hover for the values at each round.

Q2: How can we quantify Physical RSI and its scaling law?

Predicting the order from public capability profiles

Classical scaling laws relate performance to model size and training compute, which closed-source models do not disclose. Observational scaling instead uses public benchmark scores, aggregated into spatial reasoning, perception, coding and harness-use factors, as an observable substitute. Public capability profiles reproduce the observed order of both the best score by K17 and T50, the half-gain round.
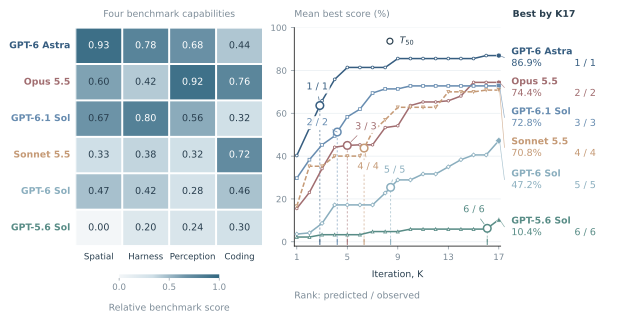
Left: four capability profiles of each system from 17 public benchmarks. Right: best mean score by round for six systems, with circles at the half-gain round and predicted / observed rank labels.
Predicting the timing of gains from public capability profiles. Left: four capability profiles of each system, computed from 17 public benchmarks as normalized ranks among the six systems. Right: best mean score on the 18 tasks. Labels give predicted / observed ranks; each pair of systems is predicted from the other four.

Q2: How can we quantify Physical RSI and its scaling law?

What can early physical feedback predict?

A Weibull template fitted to Astra, calibrated on GPT-6.1 Sol's K1–K5, forecasts K6–K17 with mean absolute error 0.019, versus 0.112 for holding the last observed score.
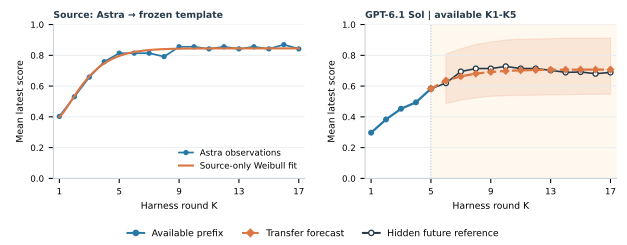
Left: Astra's mean score with a fitted Weibull template. Right: GPT-6.1 Sol's observed K1 to K5 scores, the forecast through K17 with a 90% bootstrap band, and the hidden actual rounds.
Forecasting GPT-6.1 Sol from Astra's improvement shape. Left: Astra's mean score and the Weibull template fitted to it. Right: GPT-6.1 Sol with K1–K5 available; the template forecasts the hidden rounds through K17, with the 90% paired-task bootstrap band shaded.

Q3: Does Physical RSI reflect overfitting or generalization?
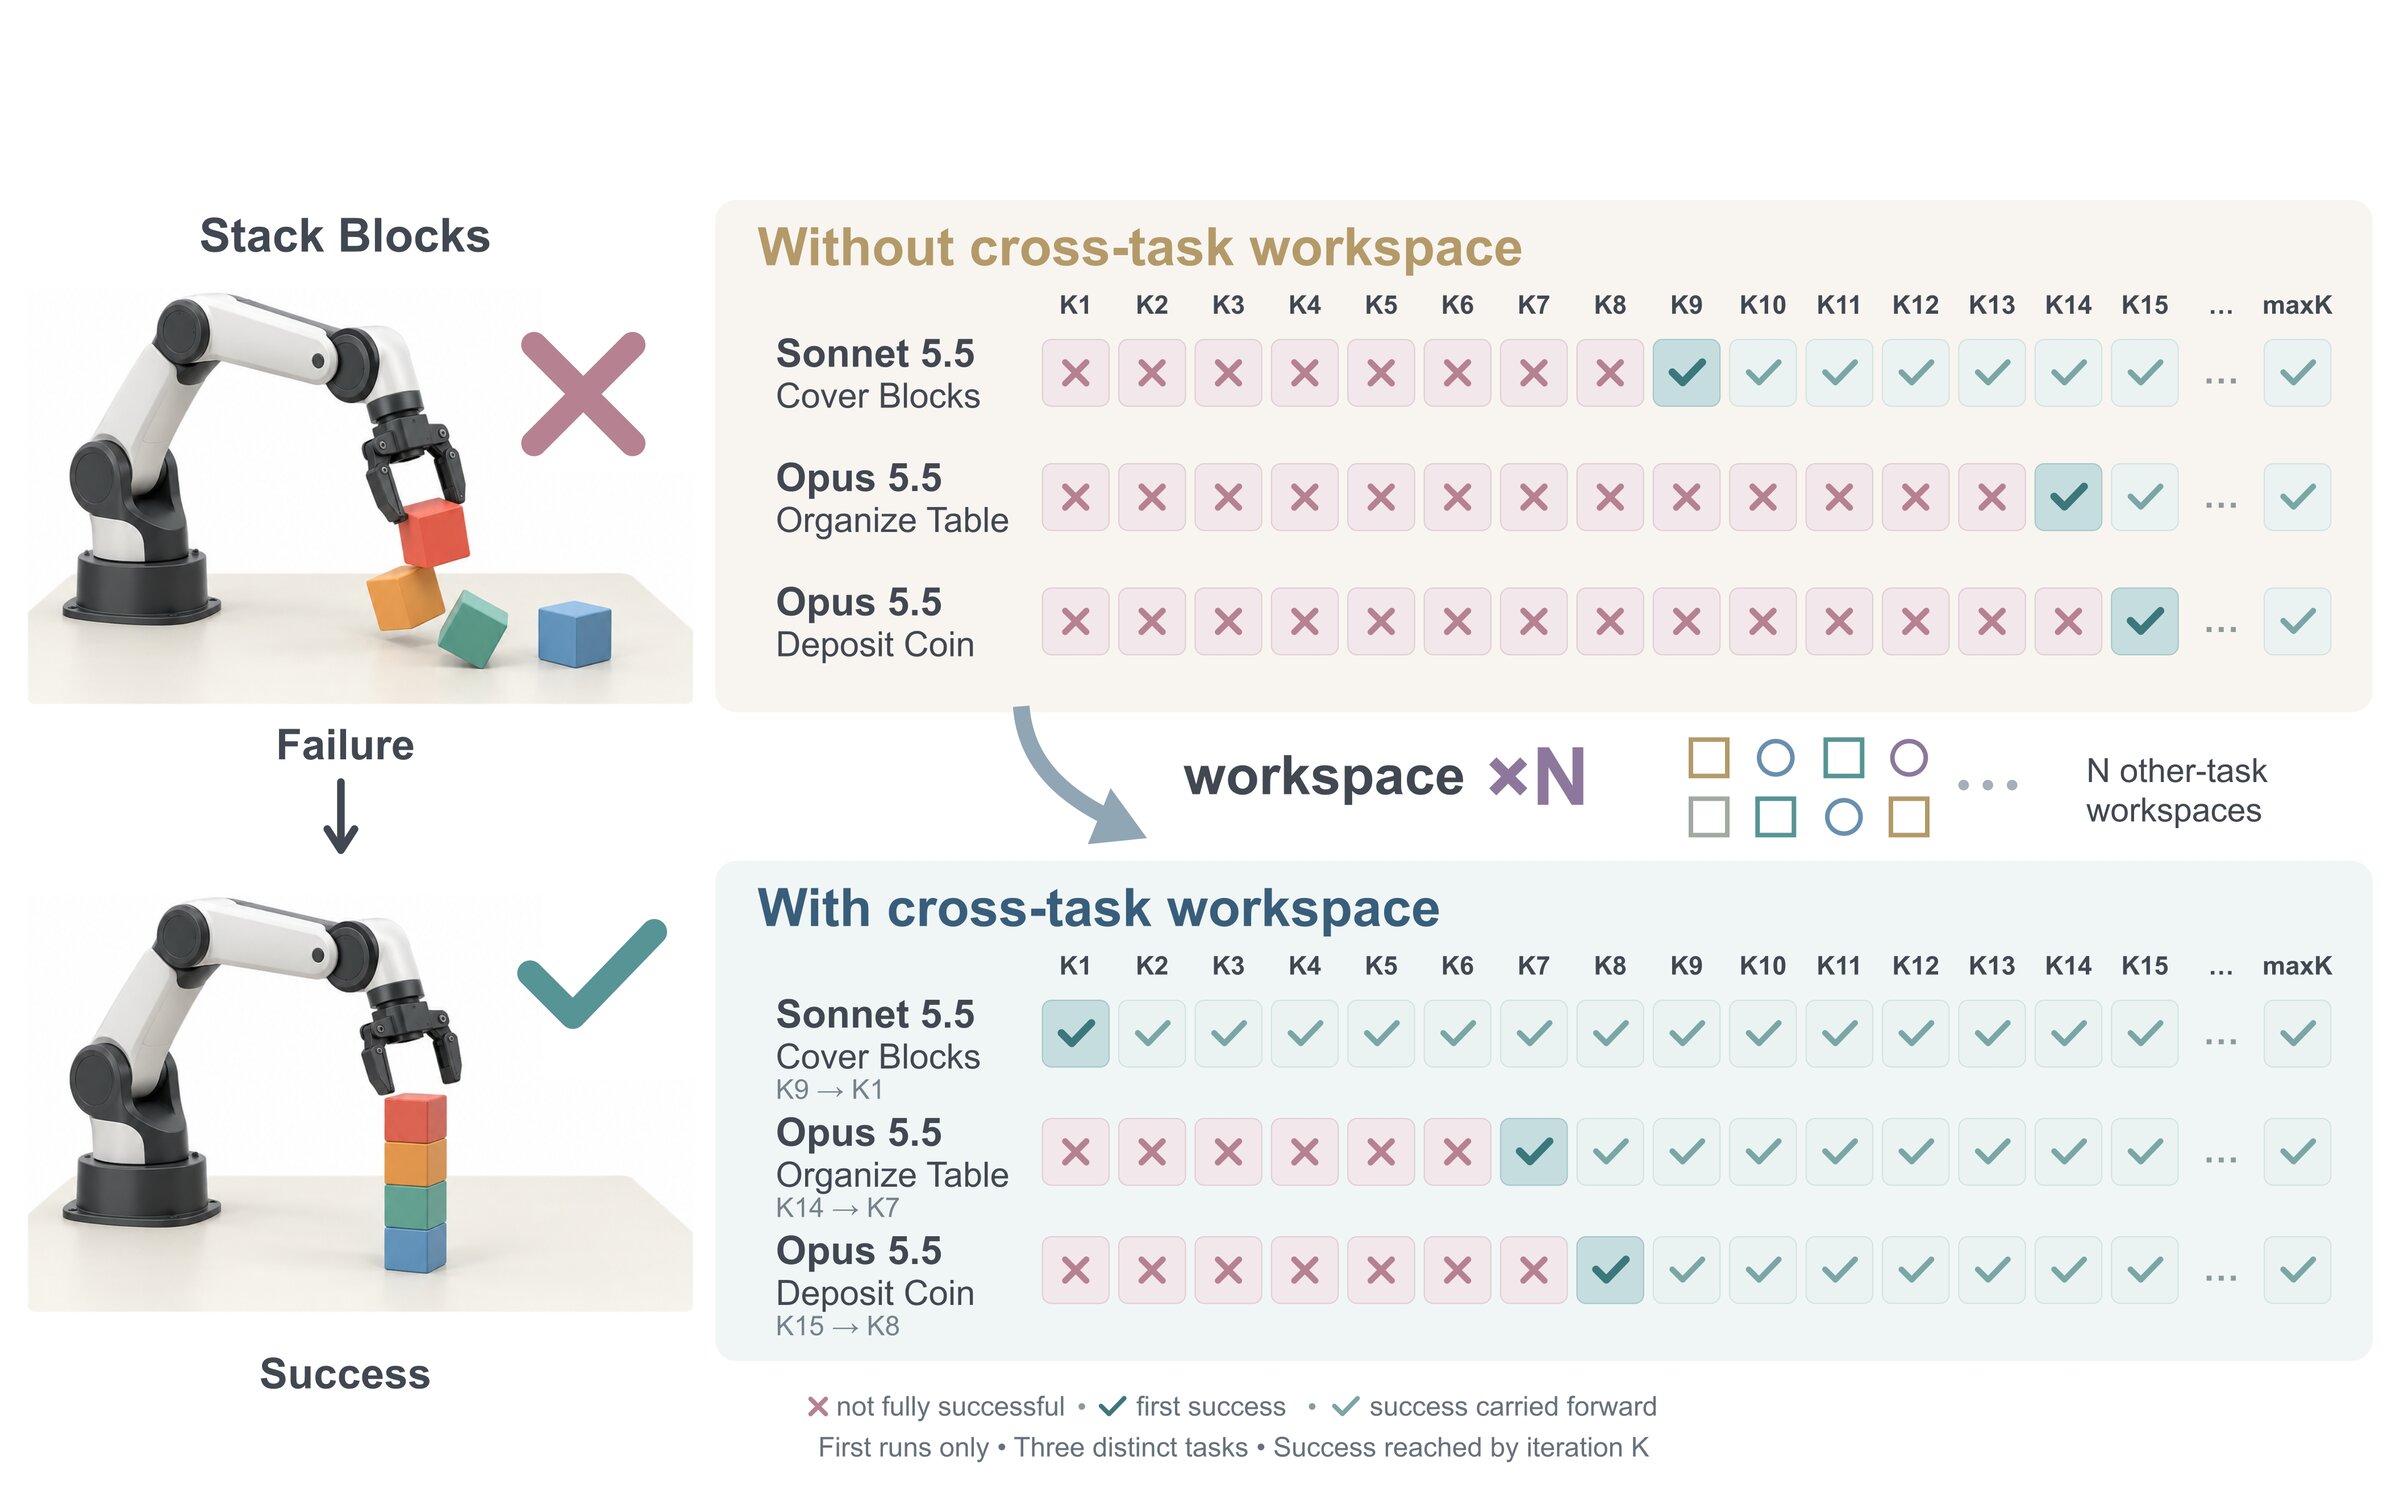
Three task chains with and without a transferred workspace: first success moves from K9 to K1 for Sonnet 5.5 on Cover Blocks, from K14 to K7 for Opus 5.5 on Organize Table, and from K15 to K8 for Opus 5.5 on Deposit Coin.
Cross-task workspace transfer. Top: original trajectories for tasks first solved at K6 or later. Bottom: trajectories initialized from a workspace pooled from all other tasks. First success advances from K9 to K1 (Sonnet 5.5, Cover Blocks), K14 to K7 (Opus 5.5, Organize Table) and K15 to K8 (Opus 5.5, Deposit Coin).

Q3: Does Physical RSI reflect overfitting or generalization?

Does retained experience help beyond repeated attempts?

Astra ablation on six tasks, two chains each, layouts changing every round. Late-round success: 41.7% with the full loop, 8.3% without history.

RoundFull loopFixed layoutNo earlier imagesNo grader feedbackWorkspace + grader onlyNo history
K1111001
K2231212
K3663221
K4684270
K5573230
K6475173
K4–K615/3622/3612/365/3617/363/36

Per-round online success in the Astra ablation. Successes out of 12 chains per condition and round; K1–K6 run in full.

Q3: Does Physical RSI reflect overfitting or generalization?

What survives when revision stops?

Astra workspaces frozen after K6 and run on five unseen layouts, with no revision or feedback.

ConditionSourcesSuccesses / nRate
Full-loop workspaces; workspace files only1225/6041.7%
Full-loop workspaces; test agent may read prior raw records1223/6038.3%
Fixed-layout workspaces on new layouts1227/6045.0%
No-image workspaces (incomplete)9 (6)13/3537.1%
No-grader workspaces (incomplete)6 (1)5/2123.8%

Frozen held-out test of Astra K6 workspaces. 12 sources × 5 held-out layouts for the complete conditions; fixed-layout sources reach 45.0% on held-out layouts versus 88% (14/16) on their own layout.

Q3: Does Physical RSI reflect overfitting or generalization?

Can experience help on a different task?

Sonnet 5.5 and Opus 5.5 encode control in self-written tools that generate over 96% of later-round actions; Opus reuses the broadest toolbox (lineage reuse 0.347 vs 0.167 for Sonnet and 0.086 for GPT-6 Sol).
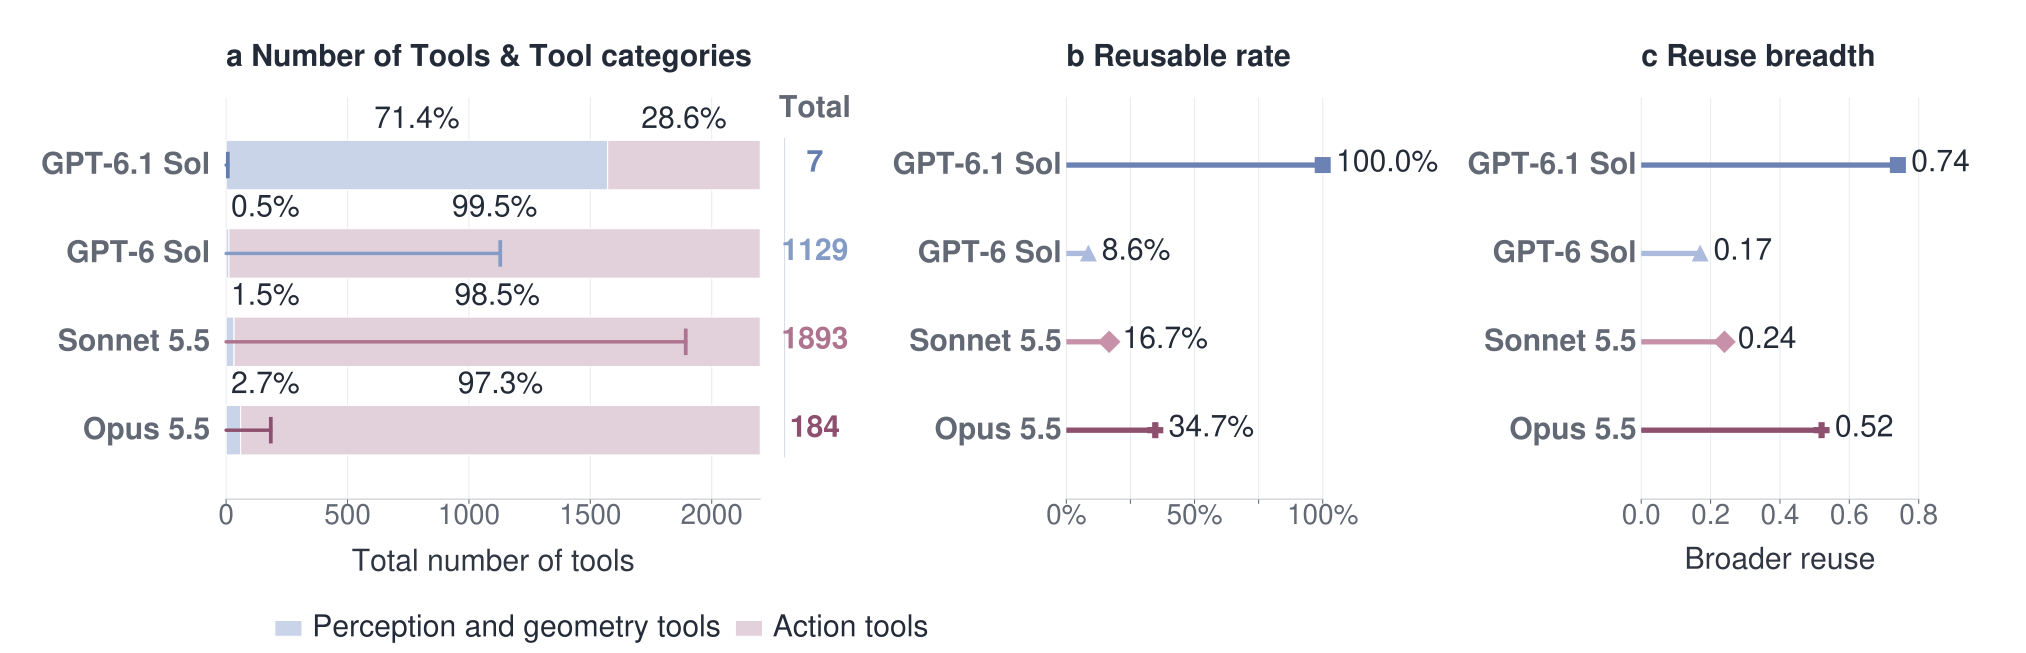
Three panels for GPT-6.1 Sol, GPT-6 Sol, Sonnet 5.5 and Opus 5.5: total tool counts split into perception and geometry tools versus action tools; reusable rate of tool lineages; and reuse breadth.
Tool libraries and reuse across models. (a) Total tool counts and the proportions of perception and geometry tools versus action tools. (b) Fraction of tool lineages reused in subsequent rounds. (c) Reuse breadth: one minus the share of subsequent calls accounted for by the top 10% of reused lineages. Astra is omitted because it creates very few tools; GPT-6.1 Sol's estimates reflect a library of seven tools.

Citation

@misc{li2026physicalrsicapabilityfrom,
  title={Where is Physical RSI capability from? An Observational Scaling Law of LLM-as-policy},
  author={Zekai Li and Jiayi Yu and Jinlu Zhang and Luyang Niu and Zekun Qi and Jun Zheng and Xuchuan Chen and Dairu Liu and Yintianrun Zhang and He Wang and Li Yi},
  year={2026},
  eprint={2610.26848},
  archivePrefix={arXiv},
  primaryClass={cs.RO},
  url={https://arxiv.org/abs/2610.26848}
}